
(IBC) Individual Blade Control DATA
Introduction
In the spring of 2009 a UH-60 rotor equipped with a unique control system was tested in the 40- by 80-foot wind tunnel at the NASA Ames Research Center1. This control system is called Individual Blade Control (IBC). IBC is unique in its ability to inject high-frequency pitch inputs (>1 pitch oscillation per revolution) and to tailor these pitch inputs for each blade in a rotor. IBC has the potential to improve performance and to reduce vibration, structural loads, and radiated noise.
Traditional rotor simulation technologies employing lifting-line theory have had modest success predicting the benefits of IBC, but a new simulation technique has the potential to close the gap between predicted and measured performance.
The weakness of traditional rotor simulation technologies (sometimes called Comprehensive Codes because they model many different aspects of a rotor s operation) is that ÷ they rely on simplified aerodynamic models. Depending on the assumptions made within the model, it may or may not accurately reflect an actual flowfield. Navier-Stokes Computational Fluid Dynamics (CFD) takes a more first-principles approach to modeling an aerodynamic environment and can provide more accurate aerodynamic predictions over a wide range of operating conditions. However, CFD simulations are computationally costly and generally lack the ability to model other aspects of rotor operation such as structural dynamics and trim.
The new technology in rotor simulation involves coupling these two simulation techniques together, gathering their strengths and discarding their weaknesses. This new technique is often (although somewhat inaccurately) called CFD/CSD coupling. A recent study by Yeo et al. was published correlating a coupled CFD/CSD solution against data obtained during the UH-60 IBC wind tunnel test.
Summary of Results
Yeo et al. compared rotor performance (power), IBC actuator force (analogous to pitch-link loads), flap and chordwise bending moments, and vibratory hub loads measured during the wind tunnel test to those predicted by a comprehensive code (CAMRAD II) with and without a coupled CFD code (OVERFLOW 2). The comparison was performed at advance ratios of 0.35 and 0.4 with the simulated rotor trimmed to match the operating conditions in the wind tunnel.
Rotor Performance
Neither simulation was particularly adept in predicting absolute power (the power measured at the rotor for any given operating condition during the test), therefore power variation (the difference between power with and without IBC input) was the primary metric for comparison. Selected graphs of power variation vs. IBC phase for various IBC amplitudes at and advance ratio of 0.4 is given in Figure 1. From Figure 1 it is clear that CAMRAD II alone significantly under predicts the benefit of IBC and exhibits a phase shift in the trend of power variation. However, the coupled simulation shows excellent correlation in both magnitude and phase for all IBC magnitudes. The uncoupled CAMRAD II simulation correlated better with test data at an advance ratio of 0.35, but its accuracy was still exceeded by that of the coupled simulation.
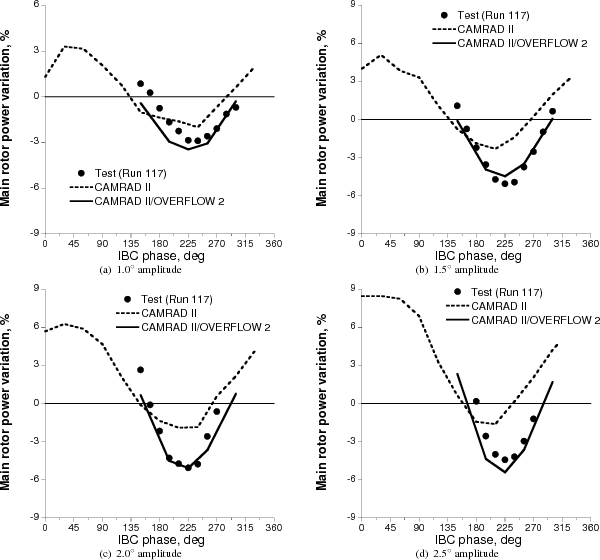
Figure 1: Correlation of main rotor power variation from 2/rev IBC phase sweep, μ=0.4.
IBC Actuator and Blade Loads
Structural loads are important in improving the operational lifetime of rotor components. Peak-to-peak IBC actuator force variation is compared to test data for various IBC inputs in Figure 2. Neither simulation produces a completely accurate simulation in this case. The uncoupled CAMRAD II simulation is somewhat more accurate at predicting the maximum reduction, but the coupled simulation seems better at capturing the trend of the curve.
The wind tunnel test exhibited an approximately 5% reduction in peak-to-peak flap bending moment with IBC. This was accompanied by a slight (~1%) increase in chordwise bending moment. Prediction of these blade load variations was generally poor for both simulation techniques.
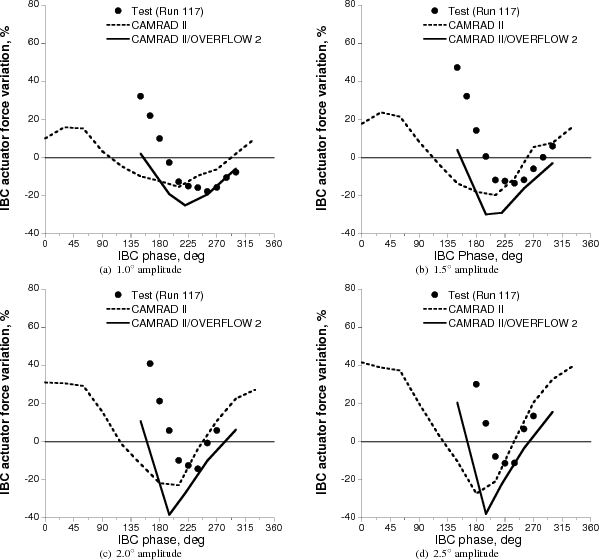
Figure 2: Correlation of peak-to-peak IBC actuator force variation from2/rev IBC phase sweep, μ=0.4.
Vibratory Hub Loads
During the wind tunnel test, IBC demonstrated the ability to tremendously alter vibratory hub loads. As illustrated in Figure 3, both simulation techniques were unfortunately unable to accurately represent the variations in hub loads due to IBC.
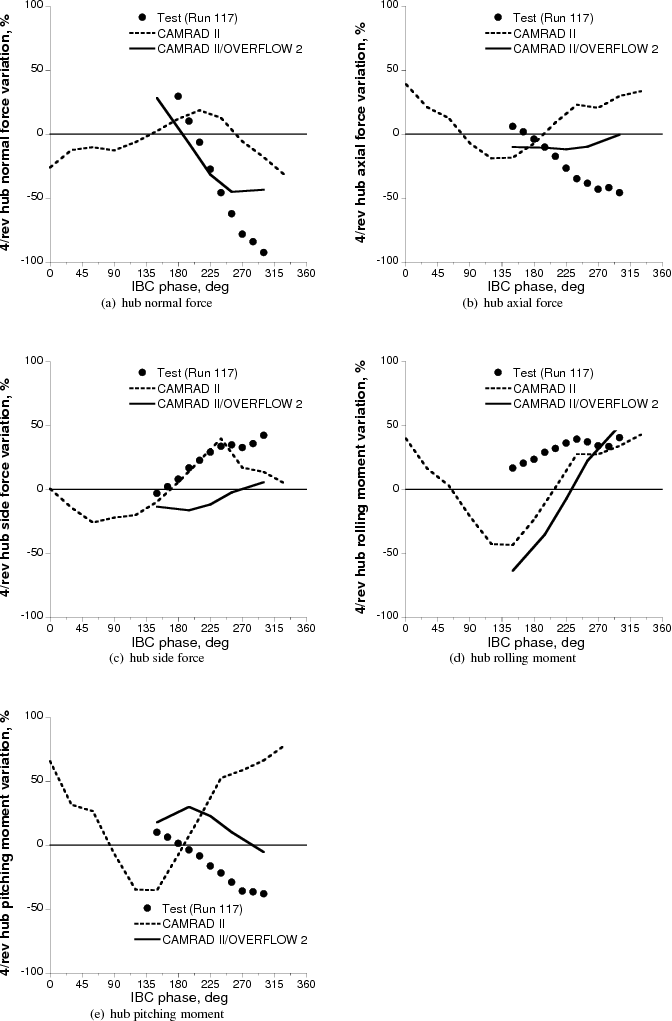
Figure 3: Correlation of 4/rev hub load variations from 2/rev IBC phasesweep (1.5¢X amplitude), μ=0.4.
Related Publications:
Norman, T.R., et al., "Full-scale Wind Tunnel Test of a UH-60 Individual Blade Control System for Performance Improvement and Vibration, Loads, and Noise Control," American Helicopter Society 65th Annual Forum Proceedings, Grapevine, TX, May 27-29, 2009
Yeo, H., Romander, E., Norman, T., "Investigation of Rotor Performance and Loads of a UH-60A Individual Blade Control System," American Helicopter Society 66th Annual Forum Proceedings, Phoenix, AZ, May 11-13, 2010